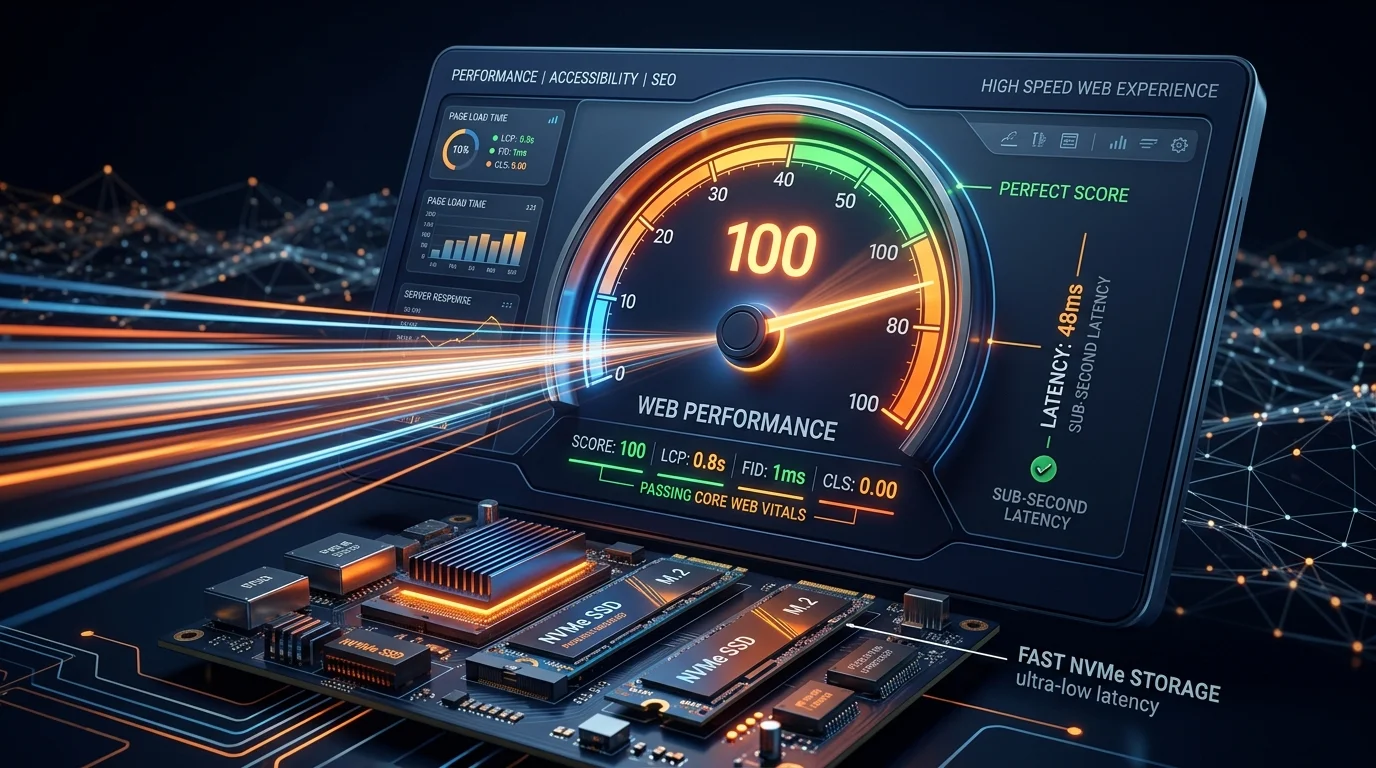
Executive Summary: Why Milliseconds Directly Dictate Your Business Revenue
Website page load speed measures the duration required for a client's web browser to download, parse, and visually execute complete webpage elements into a fully interactive state. In 2026's on-demand digital economy, velocity is no longer an auxiliary technical novelty; it represents the decisive operational catalyst governing e-commerce checkout conversions, consumer retention, and Google organic search visibility.
The Mathematical Correlation Between Load Speed and Corporate Turnover
Empirical datasets compiled by leading technology conglomerates confirm an exact mathematical correlation connecting render velocity to commercial sales:
- Google & SOASTA Research: Extending page load times from 1 second to 3 seconds triggers a 32% surge in consumer bounce rates. If loading drags to 5 seconds, visitor abandonments skyrocket by 90%.
- Amazon Infrastructure Metrics: Amazon famously determined that an incremental delay of merely 100 milliseconds (0.1s) slashes their aggregate global sales volume by 1%.
- Deloitte Digital Studies: Accelerating mobile site speed by a mere 0.1s lifted retail shopping cart order values by 9.2% and boosted travel conversion rates by 10.1%.
When prospective Indonesian buyers land on your digital storefront over mobile 4G/5G connections, they demand instantaneous visual feedback. If product interfaces stall past 3 seconds, users reflexively hit the back button and complete their purchase with agile competitors.
Deconstructing Google Core Web Vitals 2026 Benchmarks
Google formally enforces the Core Web Vitals suite as a non-negotiable search ranking factor. Webmasters must master three foundational metrics:
1. LCP (Largest Contentful Paint) - Measuring Core Visual Render Speed
LCP assesses the render timestamp when the primary visual block above the fold (hero banner image, H1 heading, or featured graphic) becomes fully visible. Google's ideal target requires LCP below 2.5 seconds. The primary culprits behind poor LCP are sluggish server TTFB latency and unoptimized legacy image formats.
2. INP (Interaction to Next Paint) - Gauging Full Interaction Responsiveness
In 2024–2026, INP officially replaced legacy FID (First Input Delay). INP quantifies how smoothly an interface responds to all visitor clicks, taps, and keypresses throughout the duration of a browsing session. The target threshold for excellent INP is under 200 milliseconds. Monolithic JavaScript bundles and unoptimized server threads represent the main causes of INP failure.
3. CLS (Cumulative Layout Shift) - Ensuring Visual Structural Stability
Few user experiences are more frustrating than attempting to tap a checkout button, only for the layout to jump abruptly because an unconstrained banner loaded late overhead. CLS measures unexpected geometric displacement. High-performing websites must maintain CLS scores strictly below 0.1.
How Server Response Time (TTFB) Governs Your Googlebot Crawl Budget
For extensive business directories and e-commerce stores hosting thousands of individual catalog URLs, server Time to First Byte (TTFB) directly controls your Crawl Budget. When host servers linger for 1,000–2,000ms before returning initial byte data, Googlebot throttles its crawl rate to prevent server overloads.
Conversely, on high-performance infrastructure like DutaSpace featuring sub-100ms TTFB metrics, search engine bots ingest dozens of catalog pages per second, indexing new inventory updates rapidly and establishing domain authority across competitive categories.
7 Engineering Tactics to Achieve Sub-Second Web Performance
Attaining peak performance scores requires harmonizing frontend optimization with enterprise-grade host infrastructure:
- Deploy Enterprise Pure NVMe SSD Arrays: Eliminating I/O bottlenecks and compiling complex relational MySQL queries up to 6 times faster than standard SATA SSDs.
- Implement Server-Level Caching (LiteSpeed LSCache): Delivering instant 0ms responses directly from web server kernel memory without repeatedly executing PHP scripts.
- Utilize Tier-3 Jakarta Data Centers with Direct IIX Peering: Slashing regional network packet transit times down to 5–15ms for domestic users across Indonesia.
- Leverage Brotli Compression & HTTP/3 QUIC: Brotli reduces static asset payloads up to 20% more efficiently than legacy GZIP, while UDP-based HTTP/3 eliminates TCP head-of-line blocking.
- Automate Media Optimization to Modern WebP Formats: Slashing visual asset weights by 50–70% while preserving pristine pixel clarity.
- Minify CSS Bundles and Defer Non-Critical JavaScript: Prioritizing above-the-fold HTML/CSS rendering before executing non-essential analytics tracking scripts.
- Integrate Redis In-Memory Object Caching: Keeping repetitive database lookup results cached in high-frequency server RAM for friction-free e-commerce checkouts.
Impact Matrix: Page Load Velocity vs Core Commercial Metrics
| Load Time Threshold | Visitor Bounce Probability | Commercial Sales Impact | Core Web Vitals State |
|---|---|---|---|
| 0 – 1.0 Second | Negligible (< 8%) | Peak Conversion Rates | Superior (Green Tier) |
| 1.0 – 2.5 Seconds | Low (9% – 15%) | Healthy, Stable Conversions | Good (Passes Google Standards) |
| 2.5 – 4.0 Seconds | High (38% – 50%) | Up to 25% Conversion Revenue Drop | Needs Improvement |
| Exceeding 4.0 Seconds | Extreme (> 70%) | Severe Cart Abandonment | Poor (Organic SEO Penalty) |
Frequently Asked Questions (FAQ)
Does deploying a global CDN always improve website performance in Indonesia?
Not necessarily. If your target market is exclusively domestic and your host server already resides in a Tier-3 Jakarta data center with direct IIX peering, routing local traffic through external global CDN edge nodes can sometimes route packets through Singapore, introducing unnecessary network hops. CDNs are most advantageous for multi-region audiences and DDoS absorption.
What average benchmark response times do DutaSpace servers achieve?
Through our synchronized architecture of Pure PCIe NVMe drives, LiteSpeed Enterprise web servers, and native LSCache engines, DutaSpace hosting consistently clocks server TTFB responses below 80–150 milliseconds and total page load times under 1.5 seconds.
Conclusion: Accelerate Your Platform, Expand Your Market Share
Website performance represents the ultimate expression of consumer respect in modern commerce. When you honor your visitors' valuable time by delivering instantaneous page responses, they reward your enterprise with longer engagement sessions, deeper brand loyalty, and recurring sales conversions.
Refuse to let outdated legacy hosting throttle your commercial growth. Upgrade to DutaSpace High-Speed Hosting, engineered explicitly to conquer Google Core Web Vitals benchmarks. Experience unmatched speed today.